Tableau is a great tool for data visualisation in an aesthetically pleasing way. It lets you easily create appealing visual representations of your data. What sets it apart from other popular data visualisation tools such as Microsoft Excel is its ability to create interactive charts and representations. You can build filters and buttons such that they can modify the display when selected. You let the user play with the data that could be engaging and fun. Tableau also provides a really easy way to organise graphics elements sitting in different sheets, onto a dashboard, which helps you creatively tell your narrative for the data. You can also arrange multiple dashboards into a story where each section tells different aspects of the story much like the chapters in a book. As if its not enough it also lets you publish your dashboard or story on its public server and allows you to embed it in your personal websites and blogs. The professional version of Tableau comes with a paid subscription but if you want to try it out, there is also a free version Tableau Public. The free public version comes with a few minor restrictions such as it lets you save your work only on the Tableau Public Server and not on the local hard disk. There is a whole community of vibrant bloggers out there sharing their works with the world.
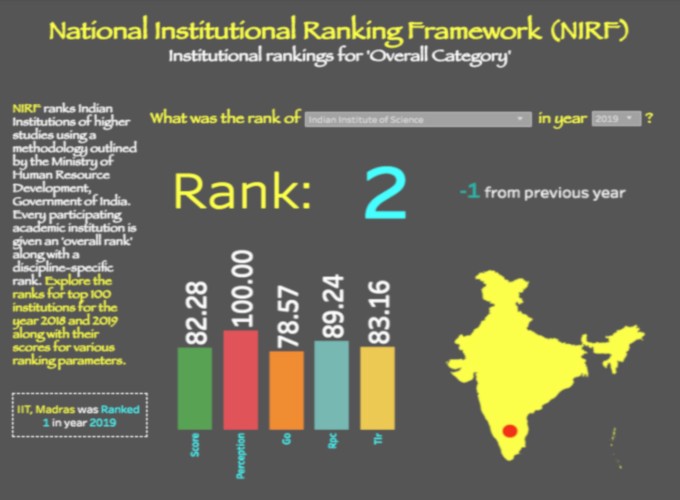
Here I build a Tableau dashboard to visualise the ranks and scores of top 100 institutions of higher education in India for the years of 2018 and 2019. These ranks are given by the Ministry of Human Resources Development, Government of India according to a ranking framework named National Institutional Ranking Framework (NIRF) established specifically for this purpose. NIRF ranks institutes in a disciple-specific manner providing a list each for Universities, Engineering Institutes, Colleges, Management Institutes, Medical Institutes, Pharmaceutical Institutes, Law Institutes, and Architecture Institutes. It also provides a separate list in Overall Category. NIRF scores every institute for the following five parameters:
| S. No. | Abbreviation | Parameter |
|---|---|---|
| 1 | TLR | Teaching, Learning & Resources |
| 2 | RPC | Research and Professional Practice |
| 3 | GO | Graduation Outcomes |
| 4 | OI | Outreach and Inclusivity |
| 5 | Perception | Perception |
Although NIRF website provides the ranks and scores for institutions in different disciplines, and for different parameters, these scores are static and non interactive. I downloaded the ranking pages in html for 2018 and 2019 and extracted the data using a perl script. The data is visualised in Tableau dashboard embedded on this page. Select the institute and the year from the pull down menu and check the scores of the that institute for various ranking parameters. You can also see how these parameters change as the ranks are arranged sequentially.
See the Dashboard on tableau public here
Please write to me if you need a copy of ranking data file.